The core argument
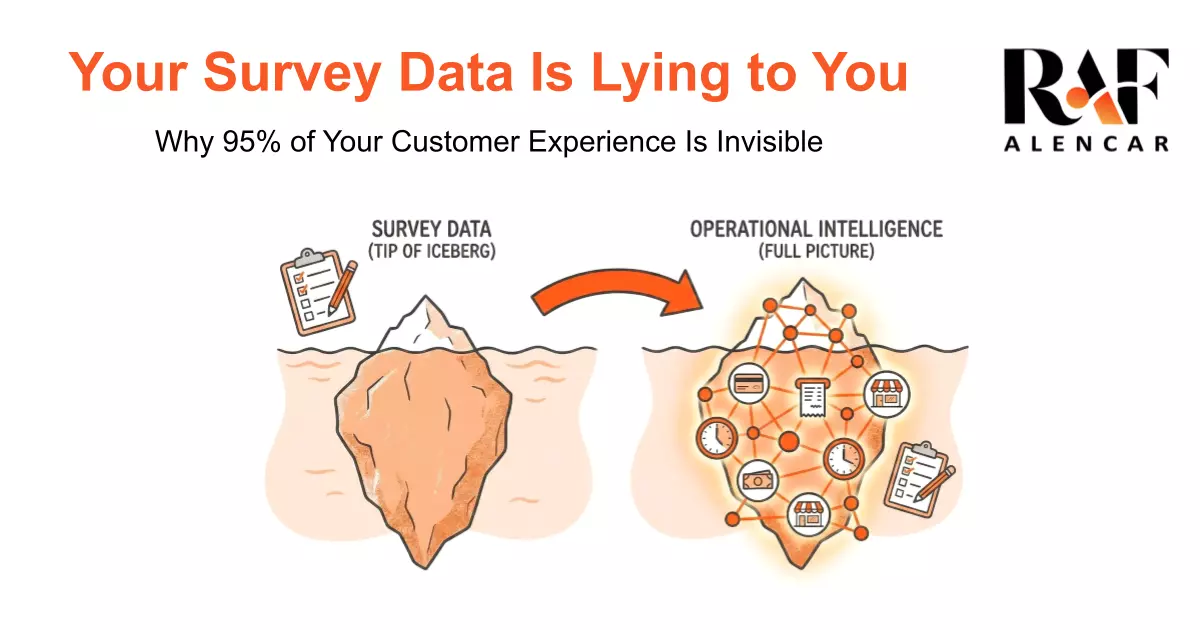
Customer experience already exists in your operational data — transaction times, supervisor interventions, staffing patterns — for 100% of customers. Surveys only capture 5%. Most organizations are optimizing the wrong layer.
An Unexpected Case Interview
During an informational interview with the leader of Customer Experience at a major Canadian retailer, the conversation turned into a case interview. His question: if you had to design a customer experience survey, what five questions would you ask?
I didn't answer right away. I asked questions of my own: When does this survey run? Who actually answers it? How is it used downstream? What decisions are leaders hoping to make from it?
We converged on five familiar drivers of satisfaction: availability, cleanliness, helpfulness of staff, price, and checkout speed. It was a good exercise.
Then the conversation moved to dashboards. How would I report this to executives? What KPIs would I track?
That's where I hesitated. Not because I haven't built hundreds of executive dashboards — I have. But because the hardest part of this problem had nothing to do with dashboard design. It had everything to do with how the problem itself was being framed.
The Hidden Constraints Nobody Questions.
Three constraints were quietly shaping everything — and blocking the path to real operational intelligence.
1. The Response-Rate Illusion. Only a small fraction of customers respond to surveys — and they are not representative. Very satisfied customers respond to say thank you. Very dissatisfied customers respond to complain. The middle majority doesn't respond at all. This creates self-selection bias. Leadership ends up reacting to extremes while flying blind on the normal, everyday experience. Improving response rates from 5% to 8% doesn't fix this. It just makes the illusion feel more scientific.
2. Tool-Defined Thinking. During the conversation I heard: "We're limited to Qualtrics." "We have Microsoft Copilot, so we can use that." The tooling had quietly become the boundary of imagination. Instead of asking "What's the best way to understand customer experience?" the problem was implicitly framed as "What can Qualtrics tell us?" That difference is subtle — and enormous.
3. The Insight Blind Spot. Despite running millions of transactions across hundreds of stores, consumer insight was defined almost exclusively as survey feedback. Operational data — POS logs, transaction duration, supervisor interventions, staffing levels — was treated as irrelevant to "experience." That's where the real opportunity lived.
Reframing the Problem.
The customer experience already exists in operational data — completely, for every customer, every transaction, every visit. Not a sample. Not a self-selected subset. All of it.
Transaction duration by store, by hour, by day. Supervisor intervention rates. Staffing-to-traffic ratios. Return rates. These are all proxies for experience — and they're already being collected, already stored, already connected to the decisions that drive them.
The survey captures 5% of customers' stated opinions. The operational data captures 100% of customers' actual behavior.
Most organizations have been optimizing the stated opinions and ignoring the actual behavior. Not because they don't have the data. Because they defined "customer insight" as survey responses and stopped asking what else was available.
What Changes When You Ask the Right Question.
When you start from "what does the customer experience actually look like?" instead of "what do our survey respondents say?", you get a fundamentally different analytical layer.
You can see which stores have systematically different transaction patterns — not because the survey said something, but because the data shows it. You can connect staffing decisions to customer behavior in real time. You can identify the specific operational conditions that correlate with the friction customers are experiencing — even the ones who never filled out a survey.
That's not a better dashboard. That's a different model for understanding what's happening and why.
The constraint was never the data. It was the assumption about which data counts.